KPIs
ESG ratings
As part of our efforts to build a sustainable ocean economy, we have been investing in the expansion of ESG ratings coverage in the fish & seafood sector for several years. We would now like to go one step further in this area by disclosing these ratings and increasing their inclusion when compiling our portfolios.
ESG ratings still leave something to be desired in some points, such as the availability of ratings for small cap companies or the quality of the reporting of sustainability-related data. However, as part of a holistic view of companies’ sustainability performance, the disclosure of ESG ratings can effectively communicate at least a minimum level of sustainability.
For Bonafide, maximising ESG ratings is not our top priority; rather we wish to compare our portfolios with a benchmark. Our stated goal is to have better ratings than our investment universe with immediate effect and, in the medium term, the market as a whole.
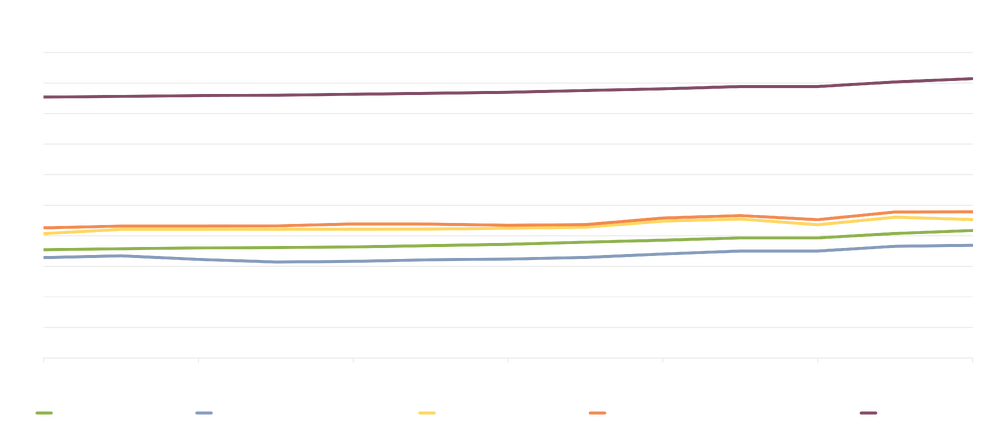
The graphic below shows the ESG scores, i.e. the scores on which the ESG ratings are based, for our portfolio and our benchmarks for the last twelve months. With our data provider ISS ESG, the range of ESG scores is between one and four, with a higher value indicating a better sustainability performance.
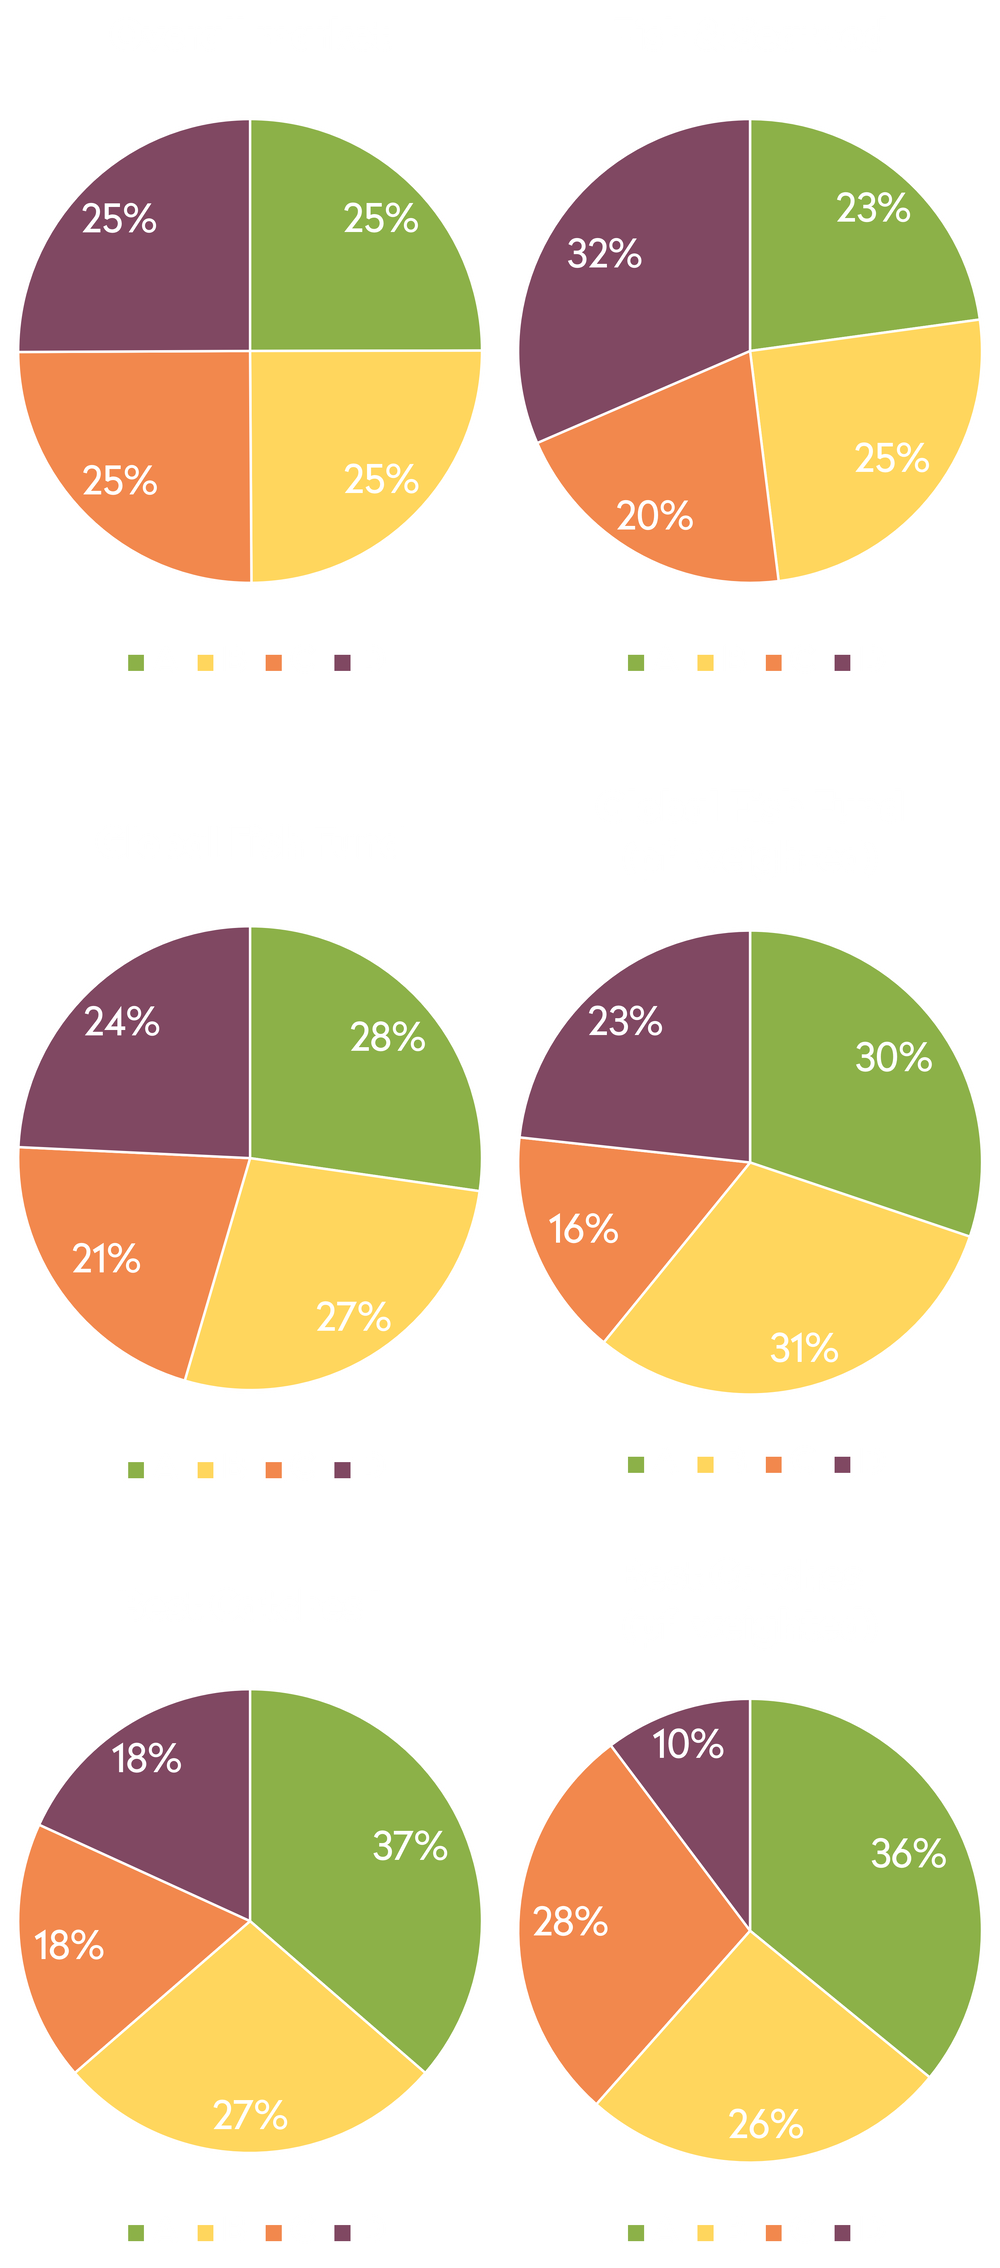
ESG scores often only differ from each other in the second decimal place, so to make them more comprehensible we have also present the current month’s scores as relative ESG ratings in the form of pie charts. Relative ESG ratings are calculated using all ESG scores available at ISS ESG. This “total market”, comprising almost 9000 scores, is divided into four quantiles and the resulting threshold values are used to award ratings.
The following graphics assume an even distribution in the compilation of benchmarks and the portfolio (unless otherwise stated). In the total market, by definition, 25% of the companies each receive the rating A, B, C and D. The other distributions should always be viewed in relation to overall market distribution. If the distributions deviate from the 25% norm, the result is always an over/under-allocation of individual ratings.
ESG Scores - Bonafide Global Fish Fund
The ESG scores, i.e. the scores on which the ESG ratings are based, are shown for our portfolio and our benchmarks in the chart below for the last twelve months. The range of ESG scores for our data provider ISS ESG is between one and four, with a higher score indicating better sustainability performance. Details on the ISS ESG compilation process can be found here.
Top 5 - Bonafide Global Fish Fund
In the table below you will find the top 5 positions of the fund and their ESG Score.
| Unternehmen | GICS Sektoren | ESG Score |
| Austevoll Seafood ASA | Consumer Staples | 1.822 |
| Mowi ASA | Consumer Staples | 2.192 |
| Salmar ASA | Consumer Staples | 2.203 |
| Leroy Seafood Group ASA | Consumer Staples | 1.982 |
| Multiexport Foods SA | Consumer Staples | 2.006 |
| Unternehmen | Austevoll Seafood ASA |
| GICS Sektoren | Consumer Staples |
| ESG Score | 1.822 |
| Unternehmen | Mowi ASA |
| GICS Sektoren | Consumer Staples |
| ESG Score | 2.192 |
| Unternehmen | Salmar ASA |
| GICS Sektoren | Consumer Staples |
| ESG Score | 2.203 |
| Unternehmen | Leroy Seafood Group ASA |
| GICS Sektoren | Consumer Staples |
| ESG Score | 1.982 |
| Unternehmen | Multiexport Foods SA |
| GICS Sektoren | Consumer Staples |
| ESG Score | 2.006 |
ESG Scores - Bonafide Investment Fund - Best Catches I
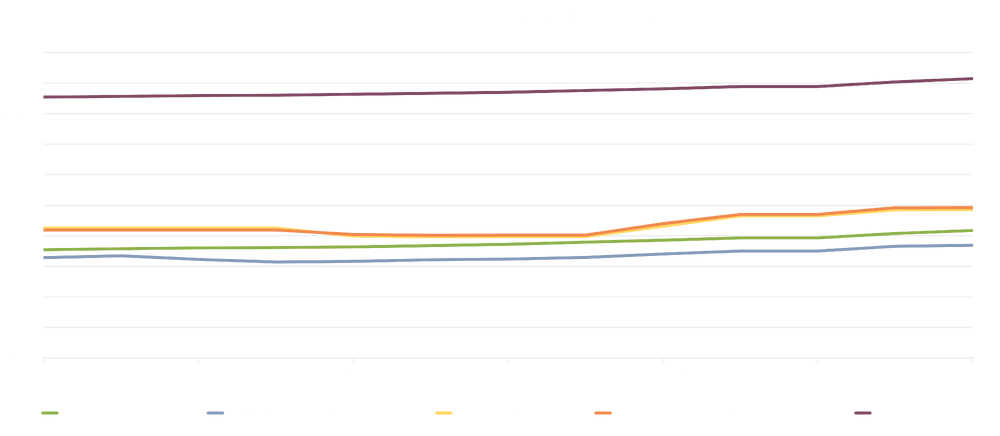
The ESG scores, i.e. the scores on which the ESG ratings are based, are shown for our portfolio and our benchmarks in the chart below for the last twelve months. The range of ESG scores for our data provider ISS ESG is between one and four, with a higher score indicating better sustainability performance. Details on the ISS ESG compilation process can be found here.
Top 5 - Bonafide Investment Fund - Best Catches I
In the table below you will find the top 5 positions of the fund and their ESG Score.
| Unternehmen | GICS Sektor | ESG Score |
| High Liner Foods INC | Consumer Staples | 1.635 |
| Clean Seas Seafood LTD | Consumer Staples | 1.630 |
| Darling Ingredients INC | Consumer Staples | 2.209 |
| Hofseth Biocare ASA | Health Care | 2.100 |
| Thai Union Group PCL | Consumer Staples | 1.862 |
| Unternehmen | High Liner Foods INC |
| GICS Sektor | Consumer Staples |
| ESG Score | 1.635 |
| Unternehmen | Clean Seas Seafood LTD |
| GICS Sektor | Consumer Staples |
| ESG Score | 1.630 |
| Unternehmen | Darling Ingredients INC |
| GICS Sektor | Consumer Staples |
| ESG Score | 2.209 |
| Unternehmen | Hofseth Biocare ASA |
| GICS Sektor | Health Care |
| ESG Score | 2.100 |
| Unternehmen | Thai Union Group PCL |
| GICS Sektor | Consumer Staples |
| ESG Score | 1.862 |
Principal Adverse Impacts
With the disclosure of the PAIs (Principal Adverse Impacts), an important step towards transparent and comparable sustainability reporting at the fund level is to be taken within the framework of the SFDR (Sustainable Finance Disclosure Regulation) as of the beginning of 2023.
You will find a non-binding evaluation of the performance of our funds in the attached files. The PDF contains a graphical representation of the performance of our funds and the overall market and investment universe as a benchmark. On the other hand, in the Excel file, the EET (European ESG Template), the exact values of the funds are listed without a benchmark.
As usual, we assess the performance of our funds against the two benchmarks. If a fund visibly lags behind both benchmarks, we take this as an opportunity to explain the reasons to the management of the companies and - if justified - to achieve an improvement of the situation.
Due to the industry's teething problems with the implementation of the SFDR, we also do not want to leave the key figures shown in the documents entirely without comment.
We advise investors to pay particular attention to the following points when assessing PAIs and to refrain from a purely quantitative evaluation of the data if possible:
Data availability
For many of the PAIs, sufficient data is already available - even if this is only an estimate by the rating providers and not, as planned, data provided directly by the companies. In some cases, however, only a few data points may be available, which reduces the significance of the respective indicator.
Data quality
The assumptions and indicators on which the rating providers' estimates are based can differ greatly from one rating provider to another. The reason for this is that the definitions of the individual PAIs sometimes leave considerable room for interpretation, and rating agencies also rely with varying degrees of success on existing data sets for measuring the PAIs. A comparison of PAIs across different rating providers should therefore be treated with caution. We advise you to read the detailed explanations provided by our rating provider ISS ESG in the SFDR Data Dictionary on the content of the PAIs and the indi-cators used. The SFDR Data Dictionary is available from Bonafide upon request.
Benchmarking
Outside of the EU taxonomy, the legislator has not yet defined any threshold values that specify when sustainability impacts are definitely to be considered adverse. It is therefore obvious to derive the threshold values on the basis of comparative values. In practice, however, the question arises as to which benchmark is best to use. For the sake of simplicity, Bonafide uses the familiar bench-marks of the overall market and investment universe. However, the comparison of individual PAIs with an absolute reference value or a more specific peer group, such as a specific sector, may be more appropriate.
European ESG Template
The European ESG Template, or EET, serves as a standardised, machine-readable exchange template for ESG data as defined in the various EU regulations. It is intended to facilitate the necessary exchange of data between manufacturers and distributors in order to comply with the ESG-related regulatory requirements contained in the SFDR, the relevant provisions of the Taxonomy Regulation, and the delegated acts supplementing MiFID II and IDD. The use of the template is not mandatory. It was developed by the FinDatEx (Financial Data Exchange) working group, a joint venture consisting of European asset managers, banks, insurance companies, pension funds and distributors. The final version was made available to the public on 14 March 2022. For funds, the template is provided at unit class level (ISIN level).
Bonafide's EET with data as of the end of the previous month is available for download here:

Carbon Footprint
By disclosing some key figures on the emissions profile of our funds, we aim to provide you with some added transparency on the issue of climate change and give you a first impression of our fund’s carbon footprint.
The selected key figures include:
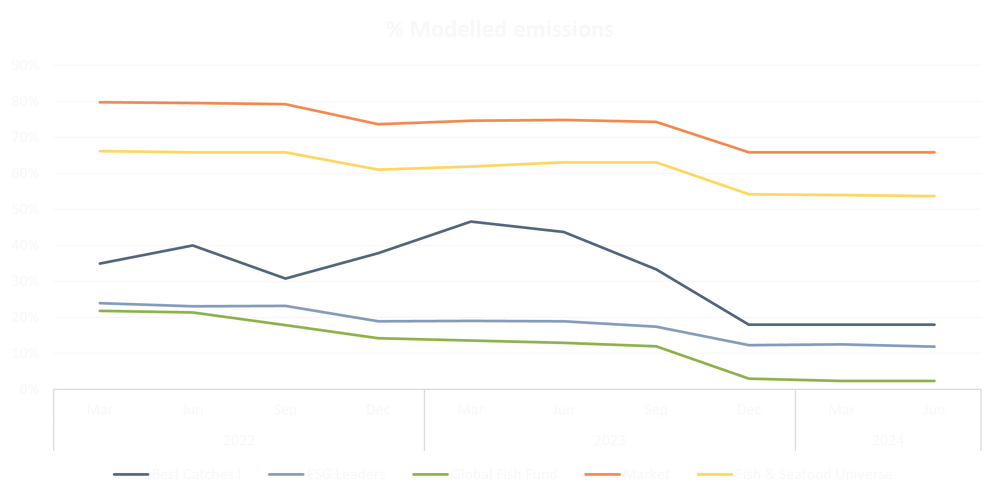
- % Modelled emissions
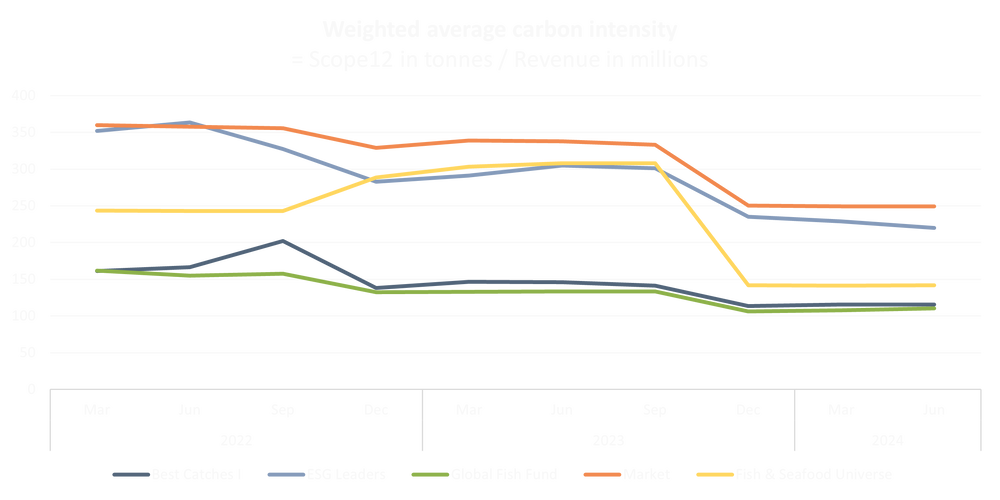
i.e. the portfolio-weighted share of companies that do not publish their emissions themselves, thus making pre-sumably less precise estimates by third parties necessary - Weighted average carbon intensity
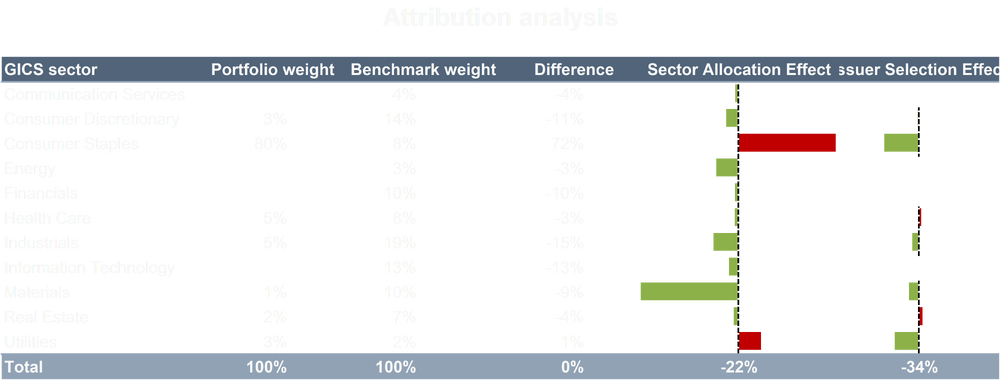
i.e. the portfolio-weighted share of CO2e emissions caused per EUR 1 million of sales generated - Attribution analysis
i.e. the separation of weighted average carbon intensity into effects from sector allocation and active issuer selection

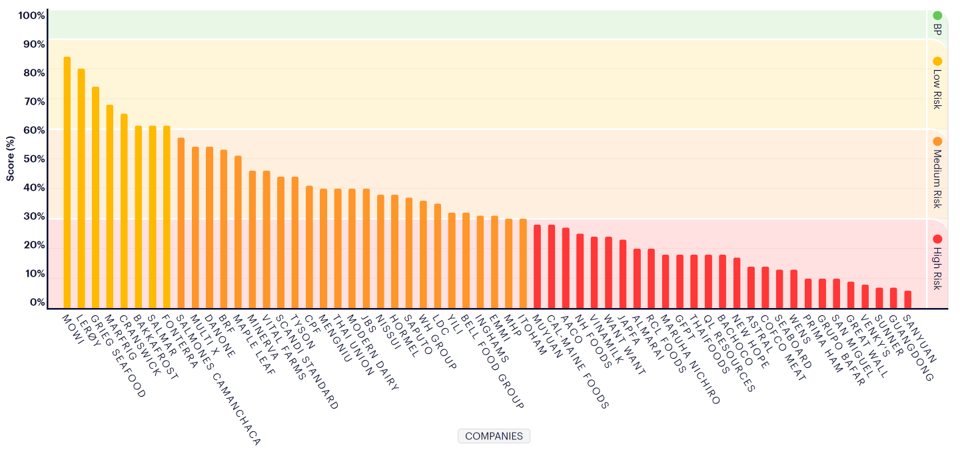
FAIRR Protein Producer Index
The Coller FAIRR Protein Producer Index was launched in 2018 to fill the knowledge gap on the ESG risks associated with the food sector. The index evaluates 60 of the largest listed global meat, dairy and aquaculture companies based on ten ESG factors:
- Greenhouse gas emissions
- Deforestation and biodiversity
- Water consumption and scarcity
- Waste and pollution
- Antibiotics
- Working conditions
- Animal welfare
- Food safety
- Corporate governance
- Alternative proteins
In 2023, there were seven salmon farmers in the top 10 alone.
There is no sustainability without development.